![The Santa Supply Chain [Infographic]](https://www.fronetics.com/wp-content/uploads/2024/10/Santa-Supply-Chain-Infographic-799x675.png)
by Fronetics | Dec 2, 2014 | Blog, Logistics, Strategy, Supply Chain, Transportation & Trucking
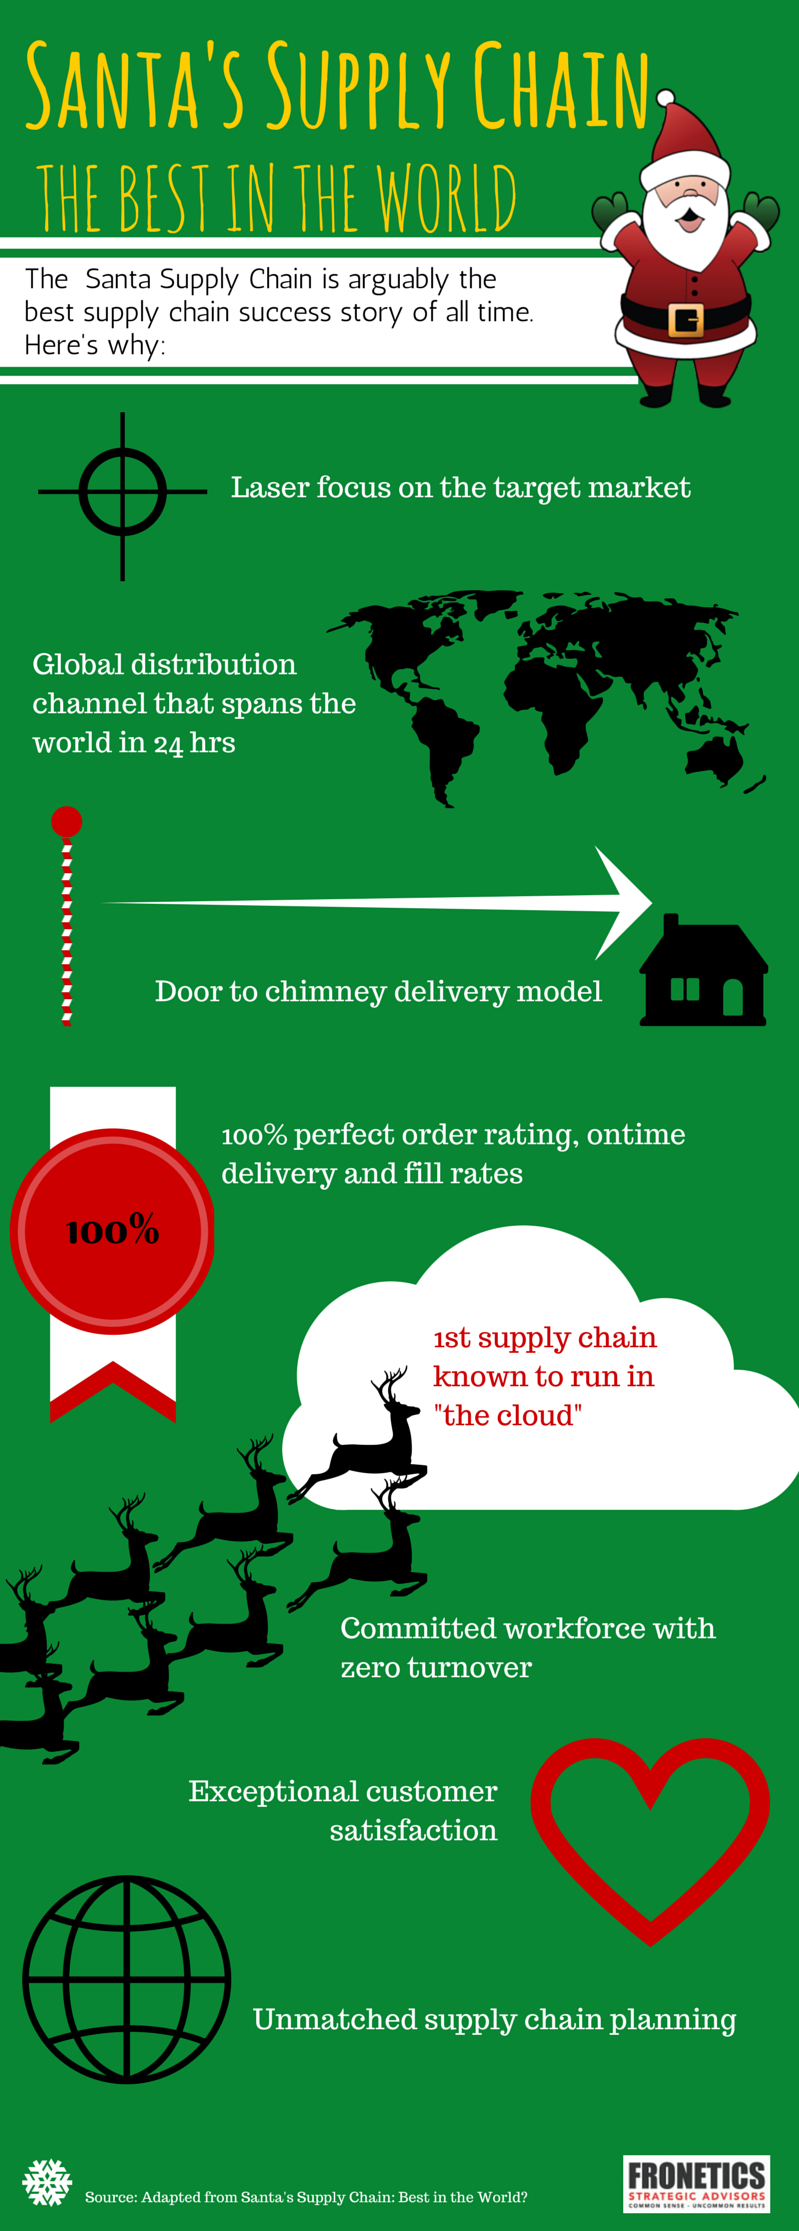
“Gartner likes to publish the Top 25 Supply Chains every year. Unfortunately, there’s one supply chain the esteemed analyst firm continues to overlook. And it just so happens to be the greatest supply chain success story of all time. I’m talking about The Santa Claus Supply Chain.”
Richard Howell’s 2011 article proposing that Santa’s Supply Chain is superior to those on Gartner’s list leaves little room for argument. Let’s be honest, is there another supply chain that can (using just one sleigh) deliver orders to 822 homes per second and has a:
- Committed workforce with a 0% turnover rate (Dasher, Dancer, Prancer, Vixen, Comet, Cupid, Donner, and Blitzen are loyal and long-serving);
- 100% order rating; and
- 100% on-time delivery?
I think not.
Check out Howell’s article for more interesting facts, and our Santa Supply Chain infographic for holiday fun.
by Fronetics | Dec 2, 2014 | Blog, Logistics, Strategy, Supply Chain, Transportation & Trucking
“Gartner likes to publish the Top 25 Supply Chains every year. Unfortunately, there’s one supply chain the esteemed analyst firm continues to overlook. And it just so happens to be the greatest supply chain success story of all time. I’m talking about The Santa Claus Supply Chain.”
Richard Howell’s 2011 article proposing that Santa’s Supply Chain is superior to those on Gartner’s list leaves little room for argument. Let’s be honest, is there another supply chain that can (using just one sleigh) deliver orders to 822 homes per second and has a:
- Committed workforce with a 0% turnover rate (Dasher, Dancer, Prancer, Vixen, Comet, Cupid, Donner, and Blitzen are loyal and long-serving);
- 100% order rating; and
- 100% on-time delivery?
I think not.
Check out Howell’s article for more interesting facts, and our Santa Supply Chain infographic for holiday fun.
by Fronetics | Oct 23, 2014 | Blog, Supply Chain
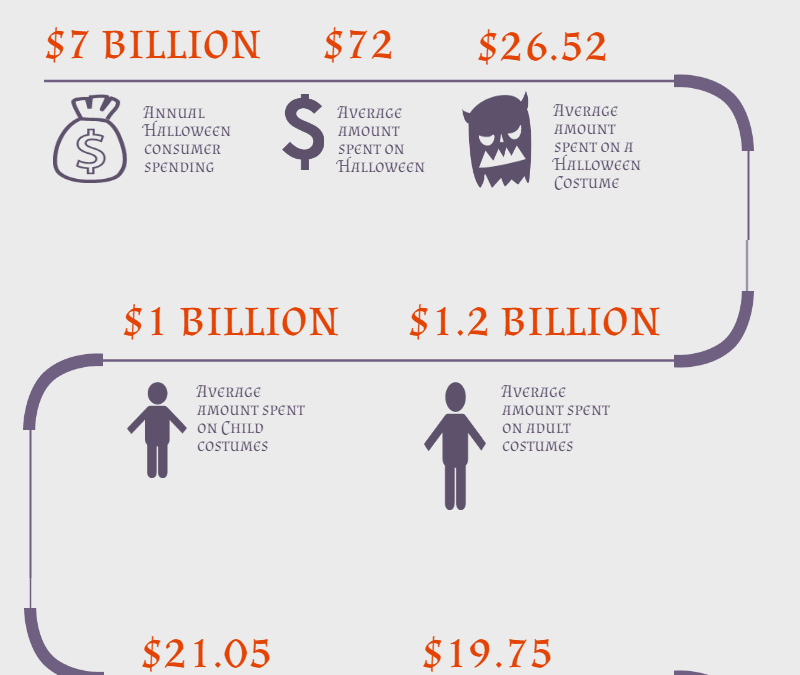
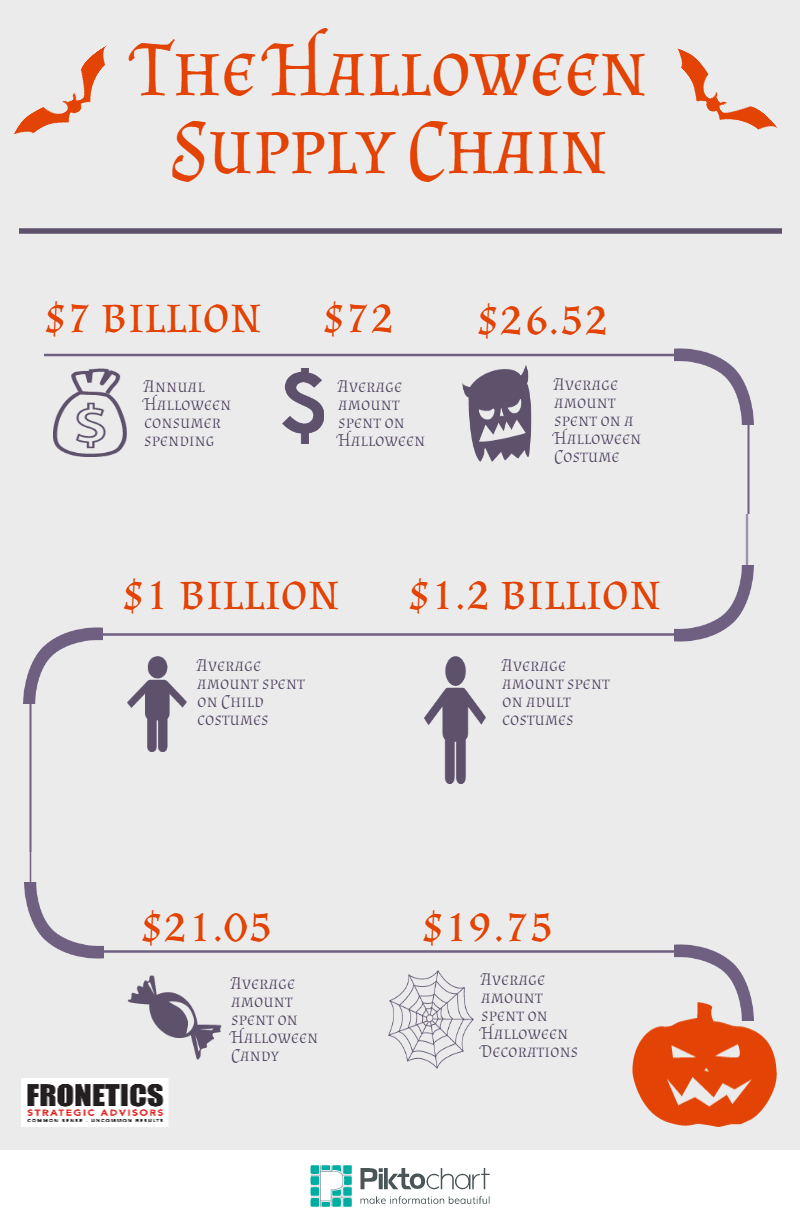
This year 68.5 percent of Americans plan on celebrating Halloween. To celebrate, Americans spend – a lot. Consumer spending for the day tops $7 billion.
During the week of Halloween 90 million pounds of chocolate will be purchased, and a total of $1.9 billion will be spent on candy alone. $2.1 billion will be spent on Halloween costumes (the most popular adult costume is a witch and the most popular costume for children is a princess), and consumers will spend an average of $19.79 on Halloween decorations.
For the supply chain and logistics industry, Halloween is big business. Here’s Halloween supply chain by the numbers.
by Fronetics | Oct 23, 2014 | Blog, Supply Chain
This year 68.5 percent of Americans plan on celebrating Halloween. To celebrate, Americans spend – a lot. Consumer spending for the day tops $7 billion.
During the week of Halloween 90 million pounds of chocolate will be purchased, and a total of $1.9 billion will be spent on candy alone. $2.1 billion will be spent on Halloween costumes (the most popular adult costume is a witch and the most popular costume for children is a princess), and consumers will spend an average of $19.79 on Halloween decorations.
For the supply chain and logistics industry, Halloween is big business. Here’s Halloween supply chain by the numbers.
by Fronetics | Oct 21, 2014 | Blog, Data/Analytics, Marketing, Social Media
Individuals within the logistics and supply chain industries want to learn more about social media ROI. A recent survey conducted by Fronetics found that 81 percent of respondents reported that information on proving social media ROI would be helpful to their company.
Proving social media ROI can seem impossible, but it is not if you put the right framework in place. Here’s how to put that framework in place, and prove social media ROI:
Set goals
Support your goals with SMART objectives. This allows you to track and measure your progress towards meeting your goals.
- Specific: Describe your objectives specific to the results you want. Go deeper than “gain leads” to “achieve a visitor to lead conversion rate of one percent.”
- Measurable: Metrics are essential. You can’t assess your progress towards your goal without metrics.
- Achievable: Make your goal achievable. A visit to lead conversion rate of 10 percent may not be realistic. Your goal of a visitor to lead conversion rate may be more plausible. When setting your objectives, keep reality in check.
- Realistic: As with any job, you need to have the right tools. Make sure that you have the resources, tools, and talent to meet your objectives.
- Timed: Be specific with your objective and incorporate a time frame.
Track and measure
Once you have set your goals and objectives and have identified your key metrics, put a system in place that will track and measure your metrics. At the very least, your metrics should be tracked on a monthly basis.
React
Tracking metrics is not enough. You need to react. Look at your metrics in the context of your goals and objectives. Which efforts are moving you towards your objectives and goals? Which efforts are not supporting your goals and objectives? Can these efforts be tweaked? Should you scrap them and try something new?
Taking a data driven approach is critical to proving ROI.
Wash. Rinse. Repeat.
This process is not static. When you achieve your goals and objectives, set new ones. If you are really struggling to meet your goals and objectives, you may need to revisit them to determine if they need to re-worked.
Proving social media ROI is possible. But it needs to be supported by a framework. Take the time to put a solid framework in place for your business.