

This is part three of a three-part series on Twitter for B2B. See part one, Twitter for B2B, and part two, Tweet This: 20 Ideas for Twitter Content for the Supply Chain.

Leverage insights from Twitter’s analytics dashboard to improve audience engagement, reach, and content development.
Twitter is among the most popular social media platforms for companies in the logistics and supply chain industries. In fact, 95% report that Twitter is somewhat or very impactful on business. Yet 81% say that information on tracking and measuring ROI would be helpful to their business’ use of social media.
Fortunately, Twitter offers users a free tool that details how your tweets are performing and what your audience is interested in. In fact, Twitter Analytics can help you better understand your followers and refine your Twitter strategy to increase your engagement.
Here are the basic features of Twitter Analytics that you need to know.
Account home
Your account homepage offers a high-level overview of your Twitter activity in the last 28 days as compared to the previous period. This dashboard also provides information about your activity in the current month, including:
- Total tweets, impressions, profile visits, new followers, and mentions
- Your top follower, who has the most reach in your network each month
- Which tweet mentioning your name (“mention”) had the most engagement
Scroll down to see the same details for previous months.
Tweet activity
This dashboard provides metrics for each tweet in the last 28 days. You can see impressions, engagement, and engagement rate by tweet. Click on an individual tweet to get the details on engagement broken down by likes, link clicks, retweets, or replies. You can also see the day-by-day breakdown of total lkes, link clicks, retweets, and replies.
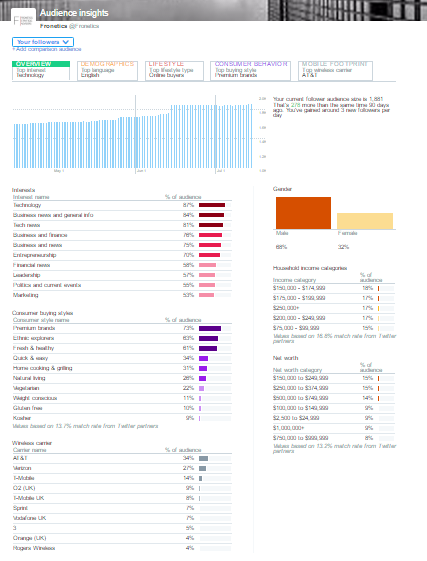
Audience insights
This is one of the most useful dashboards for insight on your followers, their behaviors, and interests. Smart marketers can use this information to better understand the kinds of content that resonates best with their audience.
The dashboard is broken down into 5 tabs:
1) Overview
See how your audience has grown over time, as well as gender breakdown, household income and net worth. Other features include:
- Interests (e.g., technology, politics, financial news, etc.)
- Consumer buying style (e.g., premium brands, gluten-free, healthy living, etc.)
- Wireless carrier

2) Audience demographics
This tab tell you about:
- Gender
- Country and region
- Language
- Household income, net worth, and home value
3) Lifestyle
Get insight into your followers regarding:
- Interests
- TV genres
4) Consumer behavior
Learn about your followers’ buying styles:
- Aftermarket auto buyer type (including the last time they purchased a vehicle)
- Consumer buying style
- Consumer goods purchases
5) Mobile footprint
Discover information about your followers’ mobile behaviors:
- Wireless carrier
- Device categories (device type) and mobile/desktop breakdown
In addition to seeing this information for your followers, you can also filter by organic audience and the entire Twitter community to compare.
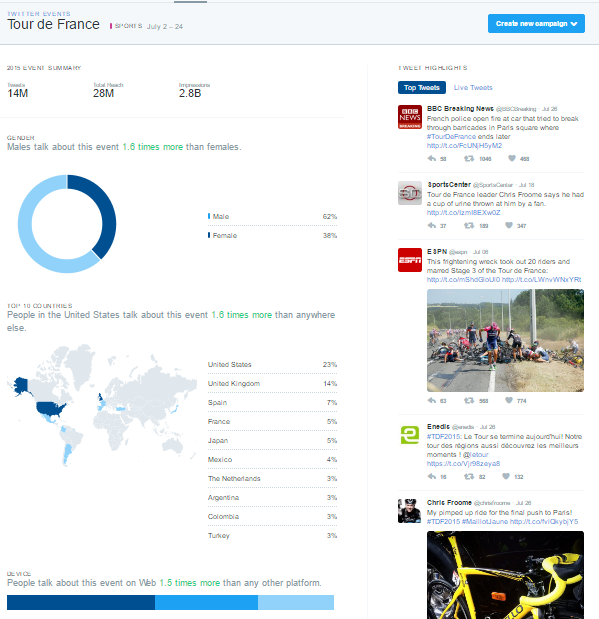
Events
Events gives you insights into how the Twitter community is discussing certain events or trends, like the Republican National Convention, Tour de France, Independence Day: Resurgence, or Throwback Thursday. Click on an event to learn about the audience that’s engaging in conversation about that topic.

Videos
The videos dashboard collects metrics on your video content. In addition to views, learn how long users are watching your videos and where users stop watching.
Twitter cards
Twitter cards allow you to include rich media in your tweets, and this dashboard helps you track how that content is being shared. You can view the following features:
- Snapshot: An overview of how your content is performing on Twitter
- Change over time
- Sources: The most popular platforms from which users send tweets linking to your content (e.g., TweetDeck, Twitter for iPhone)
- Best practices: Personalized tips for improving your content’s performance
Campaign dashboard
If you are using Twitter Ads, the campaign dashboard allows you to track the results of your ad campaigns. Check how your ads are performing in terms of:
- Impressions: This is how many times your ads have been seen by Twitter users.
- Results: These are the actions that are tied to your objectives. For example, if your goal is website visits, the results tracked will be link clicks.
- Engagement rate: This is the number of impressions for your ads, divided by the number of results.
- Cost per result: This is how much you’re paying, on average, for each relevant action people are taking from your ads.
You can see these results across all campaigns, or segmented by:
- Your different objectives: See the average results for your website clicks campaigns, or the average results for your followers’ campaigns.
- Individual campaigns: See how specific campaigns are performing against your goals.
- Individual tweets: See which combinations of copy and creative are contributing the most to your campaigns.
- Targeting criteria: See which of your targeted audiences are responding the most to your ads.
Other features
Conversion tracking
Set up conversion tracking to follow what happens after users view your ads. This way, when users click on one of your links, retweet, like, or simply see your tweet and then go to your site, you’ll know where they came from.
Quick promote
Get high-performing tweets in front of a larger audience with Quick promote. Choose your tweet; click “Promote;” target a location (worldwide, country, state/province/region or metro area); and select your budget.
Related posts:
- Twitter for B2B
- Tweet This: Ideas for Twitter Content for the Supply Chain
- 10 Ways to Gain LinkedIn Followers
- LinkedIn for B2B: Getting Started
- How to Hire Talent through LinkedIn