As Cupid spreads his wings, gifts of experience and romantic, at-home options will take over the market for Valentine’s Day 2018.
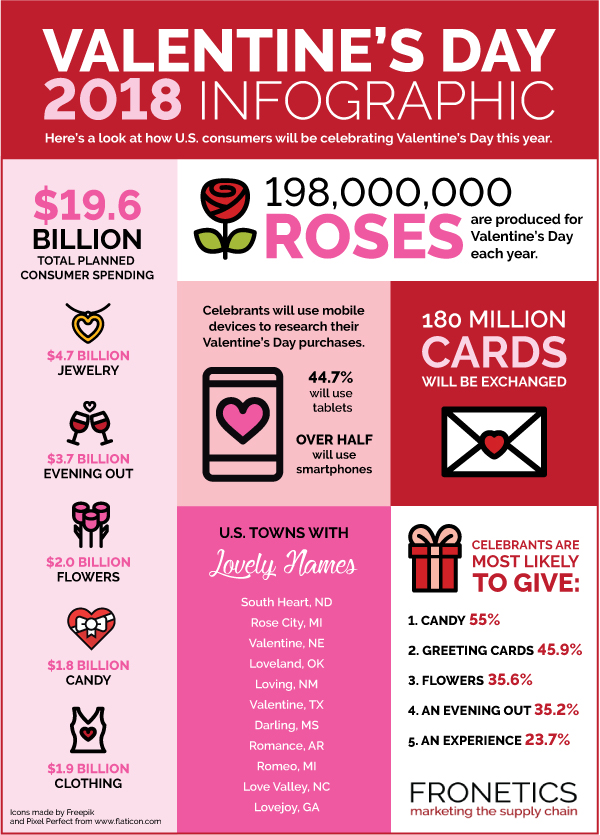
Consumers will spend a near-record $19.2 billion on Valentine’s Day 2018, up from $18.2 billion in 2017. According to NRF’s annual survey, over half of the country will participate (55%) in the romantic holiday, spending just over $140 on average.
Gifts of experience
A new Valentine’s trend is giving gifts of experience, such as a spa treatment, concert tickets, or a cooking class. Almost half of celebrants said they would prefer a gift of experience, and 23% said they plan on giving a gift of experience. Blue Apron’s Love at First Bite targets couples looking for gifts of experience with a foolproof, stay-at-home option for Valentine’s Day 2018. And they’re not the only ones! Hello Fresh, Plated and even Whole Foods are publishing blog articles and offering meal options for creating the perfect Valentine’s dinner from the comfort of your own kitchen.
Out on the town
The NRF’s survey also found that younger people (ages 18-34) are more likely to take their Valentine out for the evening than older generations. So it’s no surprise that 6 out of 10 younger celebrants (ages 18-34) would also prefer a gift of experience over candy and flowers.
Mobile trend
95% of Americans own a cell phone. The growing connection between smartphones and digital information is starting to take over Valentine’s Day, as well. Over half of participants plan to use their smartphones to assist with Valentine’s Day purchase decisions. Nearly 40% said they plan to use their cell phone to research products and compare prices.
Tradition prevails
Not to worry, though: Celebrants will still purchase plenty of flowers, jewelry and candy to mark the holiday. Celebrants are most likely to give candy as a gift, followed by greeting cards, flowers, and an evening out.
Here’s a look at how U.S. consumers will be celebrating Valentine’s Day 2018.
Valentine’s Day 2018 Supply Chain Infographic
Related posts:


