
by Fronetics | Nov 7, 2016 | Blog, Content Marketing, Logistics, Marketing, Social Media, Supply Chain
Fronetics is conducting a survey to determine how companies in the logistics and supply chain industries are using content and social media.
Have you ever wondered how your competitors, customers, and business partners are using modern marketing tools like social media? Are you curious how many companies like yours have a blog, how often they publish, and, more importantly, how many are generating new business from it?
Fronetics was curious about these questions and more. So we conducted our first industry-wide survey back in 2014 to learn how logistics and supply chain companies were using content and social media as part of their marketing programs.
The results were very telling. Though all reported leveraging these tools for only a short while, the majority had already seen a positive impact on their business. To read the full reports, click below.
Well, a lot has happened in two years. And, once again, Fronetics would like to take the temperature of the industry to see how the use of social media and content has changed (or stayed the same). So we are launching a new survey for individuals working in the logistics and supply chain industries to weigh in on how their companies are using these tools today.
Each survey takes about 3 minutes to complete. Results will be reported in aggregate, using no personal or company information from respondents. Those wishing to receive the completed report can indicate this preference during the survey.
Please click the buttons below to take our surveys. We look forward to hearing your responses!


Related posts:

by Fronetics | Nov 3, 2016 | Blog, Content Marketing, Marketing, Social Media
The web search has changed the way businesses shop for products and services — and content marketing is your key to reaching them.
What’s the first thing we all do when we need a gift for Fathers’ Day, can’t think of a song lyric, or want to buy a new kitchen appliance? We Google it.
The world of B2B sales is no different. Demand Gen’s 2016 B2B Buyer’s Survey Report found that 62% of B2B buyers say that a web search was one of the first three resources they use to learn about a solution. In fact, 94% of buyers reported using online research at some point in the purchasing process.
That means businesses must be more than just conscious of their digital presence: They must actively manage their website and digital content assets to accommodate the ways buyers are conducting research.
Seeing opportunity in the new reality
In the pre-internet age, the salesperson’s role began relatively early in the buyer’s journey. Today’s average B2B buyer, however, progresses nearly 60% of the way through this process before making any sort of contact with a sales rep. That means your prospects are forming their early opinions about your business and your products based on what they find on the web.
This new reality may seem daunting, given how much of the purchase decision-making process occurs before you have the opportunity to engage with a potential client. But in reality, this changing climate offers serious opportunities for businesses to demonstrate their expertise, without turning buyers off with overt sales pitches.
Content is king/key
To make the most of the potential purchaser’s experience with your business, content is key.
A robust content marketing strategy builds brand awareness, establishes trust and rapport with prospects, and generates traffic to your website. Thoughtfully generated and curated content catches the attention of buyers and keeps them interested in your business through the time of purchase.
Specifically, 67% more leads will be generated by companies with an active blog in 2016. And content isn’t limited to your website: a vibrant social media presence helps buyers conduct their research, with 57% of consumers reporting that they are influenced to think more highly of a business after seeing positive comments online.
Again, while this new reality may seem like a challenge, it’s actually a golden opportunity for your business to put its best foot forward with potential buyers. By thoughtfully generating and curating focused, informative content, companies can guide B2B buyers through the sales process, and develop an engaged and loyal customer base.
Related posts:
by Fronetics | Nov 2, 2016 | Blog, Marketing, Social Media, Supply Chain
Twitter will shut down its 6-second video platform; Facebook launches Recommendations feature; and more social media updates.
Twitter folds Vine
Twitter announced its plans to fold its video platform, Vine, in a Medium post on Thursday, October 27. The mobile app and website will not close immediately so that users can still access and download their Vines before they become unavailable.
The announcement follows news that Twitter would cut 9% of its workforce as it struggles to become profitable. Meanwhile, video platforms, like YouTube and Snapchat, and video capabilities on other social networks, like Instagram and Facebook, continue to soar in popularity. Read more
Facebook launches Recommendations feature and CTA buttons for local businesses
Facebook’s new Recommendations feature allows users to gather, map, and organize local business recommendations from their friends. You can pose a question, such as, “Where is the best place to buy paint?” and Facebook will auto-add extra information, like addresses and reviews, based on your friends’ responses.
Additionally, businesses can implement new call-to-action buttons to drive users to book an appointment, purchase tickets to an event, and more without ever leaving your business’ Facebook page. Read more
Facebook Live launches broadcasting tool for verified pages
Facebook Live’s new tool allows the administrators of verified pages schedule a live broadcast up to a week in advance, so that companies “can build anticipation and buzz” with their audiences. A page’s fans can wait in a virtual lobby as soon as three minutes prior to the launch of the broadcast.
As soon as a page schedules a broadcast, fans receive a notification in their newsfeeds and an option to schedule a reminder. Pages will receive a link to share or embed in websites, social media posts, and blogs. Read more
Simply Measured releases annual State of Social Marketing report
Social analytics company Simply Measured recently released its annual report regarding social media use by some of the biggest brands around the globe. The 2016 State of Social Marketing Report uncovered trends about a wide range of topics, but among the most interesting was the disconnect between how marketers are measuring social media success and what their leadership is asking for. Read more
More social media news and features to watch
Related posts:

by Fronetics | Nov 1, 2016 | Blog, Content Marketing, Marketing
Companies dedicate enormous resources to ramping up email marketing programs around seasonal pushes, like the holidays. But do they actually get more customers?
We all know the feeling — how the office buzzes, the anticipation starts to build. Busy season is around the corner, and your team is getting ready for the big push to make this the most successful year yet. But have you ever wondered if all the extra hours and money you pour into these seasonal marketing campaigns are worth it?
As the holidays approach, many businesses, especially retailers and e-commerce companies, are starting to ask themselves this question — or, at least, they should be. At what point will creating and sending another email to your database be detrimental, rather than beneficial? How much should your messaging change? Should you try something totally new and different to catch customers’ attention?
IBM Marketing Cloud’s 2016 Email Marketing Metrics Benchmark Study has some interesting answers to these questions.
The holiday email-marketing study
The 2016 Email Marketing Metrics Benchmark Study is an annual report that offers insight on how many people open, click, and ignore messages from email marketers around the globe. It aggregates data from messages sent by nearly 750 companies representing 3,000 brands in 40 countries. This year, the study also examined the performance of holiday messaging versus non-holiday messaging for retail/e-commerce vendors.
Most retailers send at least double the amount of emails during the holidays (defined as Thanksgiving to New Year’s) as they do during the non-holiday period. They entice potential buyers with aggressive pricing, free shipping, and deal deadlines. But do these more frequent, offer-loaded emails make a difference? Let’s take a look.
Click and open rates
In almost every respect, non-holiday emails outperformed holiday emails in a significant way. Open rates during the holidays were 18.8% lower than during non-holidays. Mean click-through rates differed by 28%. Mean click-to-open rates remained similar.
There are several takeaways here. Yes, open rates were lower during the holidays. But because the volume of emails sent during this period increased significantly, it’s likely that the total number of emails opened was greater during the holidays than non-holiday period. That’s a positive thing.
That being said, click-through rates decreased pretty dramatically. You would expect that special holiday offers would entice recipients to click through more often. But increased email volume seemed to detract from such motivating offers.
Similarly, click-to-open rates measure the effectiveness of email content (in driving a reader to take the requested action, e.g. redeem an offer). These rates remained relatively similar across both time periods, which is surprising. With more people looking to make purchases during the holidays, you would think that more recipients would act on the offers presented in the holiday emails. Again, increased email volume seemed to detract from their doing so.
List churn metrics
Increased email volume meant retailers processed more hard bounces, unsubscribes, and spam complaints during the holidays.
Here are the takeaways. Firstly, more emails equal more hard bounces. That seems logical enough.
Though unsubscribe and spam-complaint rates were slightly lower during the holidays, that doesn’t equal success. Because of the frequency math effect, retailers are losing a larger number of subscribers because they are sending more emails.
Say your company sends one email per week during the year, and two emails per week during the holidays. If you usually have 10 people unsubscribe per week during the year, approximately 20 people are unsubscribing during holiday weeks. That can deplete your database pretty quickly — especially if you’re more than doubling your email volume.
Conclusions
The folks at IBM Marketing Cloud had some interesting thoughts about their findings and how to increase the effectiveness of holiday emails.
For one, while increasing the number of emails you send during the holidays isn’t inherently a bad idea, as more emails equates to more total opens, many retailers are going about it the wrong way, as is evidenced by lagging click-through rates.
That’s because when many marketers ramp up email volume, they forget all the best practices that make their emails successful in the first place: personalization, targeted content, and offers that are relevant to the specific recipient based on his/her place in the buyer’s journey. Personalizing email content will help improve click-through and click-to-open rates, which could dramatically impact sales given the increased email volume.
Further, a courtesy head’s up about increasing email frequency could reduce the number of opt-outs and spam complaints. IBM Marketing Cloud suggests that companies should “consider sending an email to subscribers before you ramp up frequency, explaining the increased frequency, what kind of promotions they can expect, and shipping and return policies. Include prominent language about frequency options and link to your preference center. In addition, revise your preference-center language and options to encourage unsubscribers to opt down or snooze emails instead of simply opting out.”
Application across verticals
While the weeks between Thanksgiving and New Year’s are not every business’s busy season, the findings from this study are still applicable. If your prospects experience an uptick in marketing emails during a particular season from you and your competitors, you’re likely to experience similar results.
The key in ramping up emails prior to a big push is to retain quality — that is, customizing content and offers to the particular recipient. If you can’t scale, then you shouldn’t send.
Furthermore, this study speaks to the value of a strategic, year-round marketing program that builds brand awareness and customer loyalty, regardless of how close the busy season is. If prospects grow to know and trust your brand, they’ll turn to you when it’s time to buy, regardless of how many emails you send them in the weeks prior.
Related posts:

by Fronetics | Oct 31, 2016 | Blog, Current Events, Strategy, Supply Chain
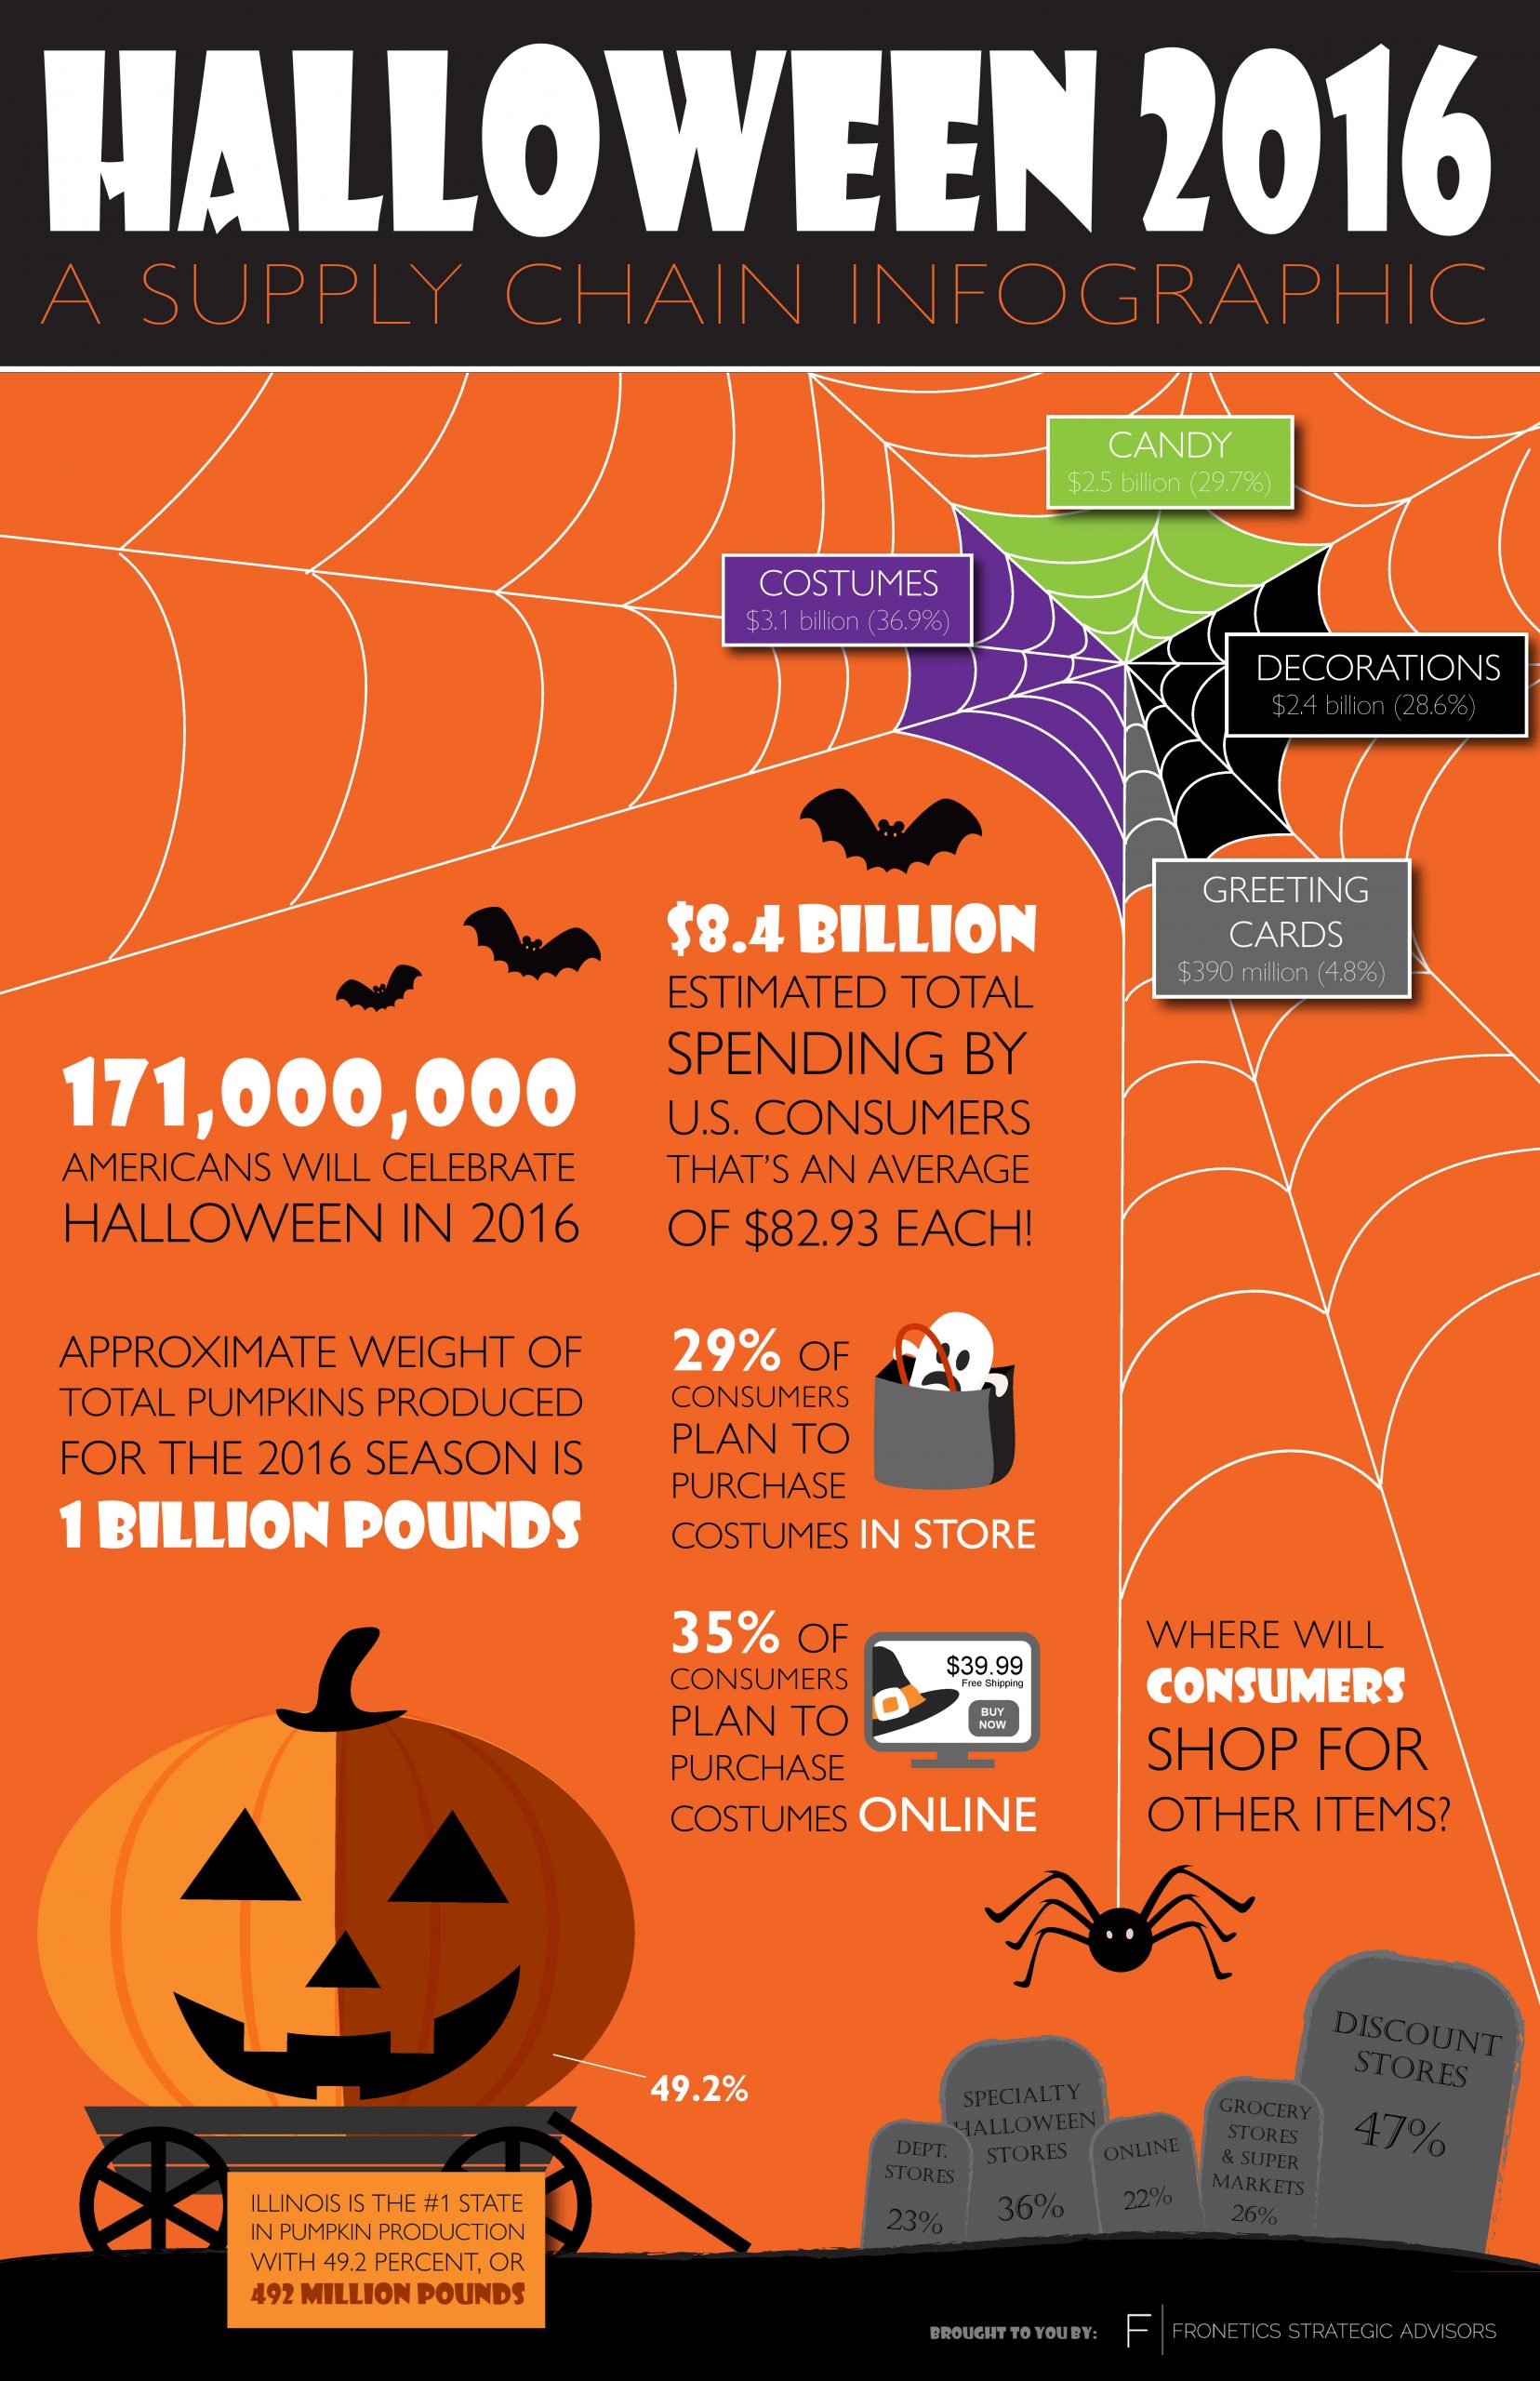
U.S. Consumers plan to spend a whopping $8.4 billion on costumes, candy, decorations, and more to celebrate Halloween 2016.
The National Retail Federation anticipates spending for Halloween 2016 will be at an all-time high.
The NRF’s annual survey found that 171 million Americans will celebrate the holiday, spending a total of $8.4 billion, the most reported in the survey’s 11-year history. Consumers plan to spend an average of $82.93 each, up from last year’s $74.34 per person spending.
As far as costumes go, NRF says to expect zombies, Minions, and characters from Star Wars and Disney’s Frozen to show up at your door. If you’re still looking for ideas yourself, try Pinterest, where 17% of consumers plan to get their inspiration for costumes this year.
Are you one of the 16% who will dress your pet up for Halloween? Take a note from last year’s top 5 pet costumes:
- Pumpkin
- Hot dog
- Batman character
- Devil
- Bumblebee
Check out our infographic of other interesting Halloween 2016 facts from the NRF’s survey of 6,791 consumers below.
Halloween 2016: A supply chain infographic
Related posts: