

Infographic: 3 Google Analytics Reports You Should Be Running to Convert More Leads
These Google Analytics reports are crucial to understanding the visitors who are browsing your website and how you are more likely to get them to convert.
Highlights:
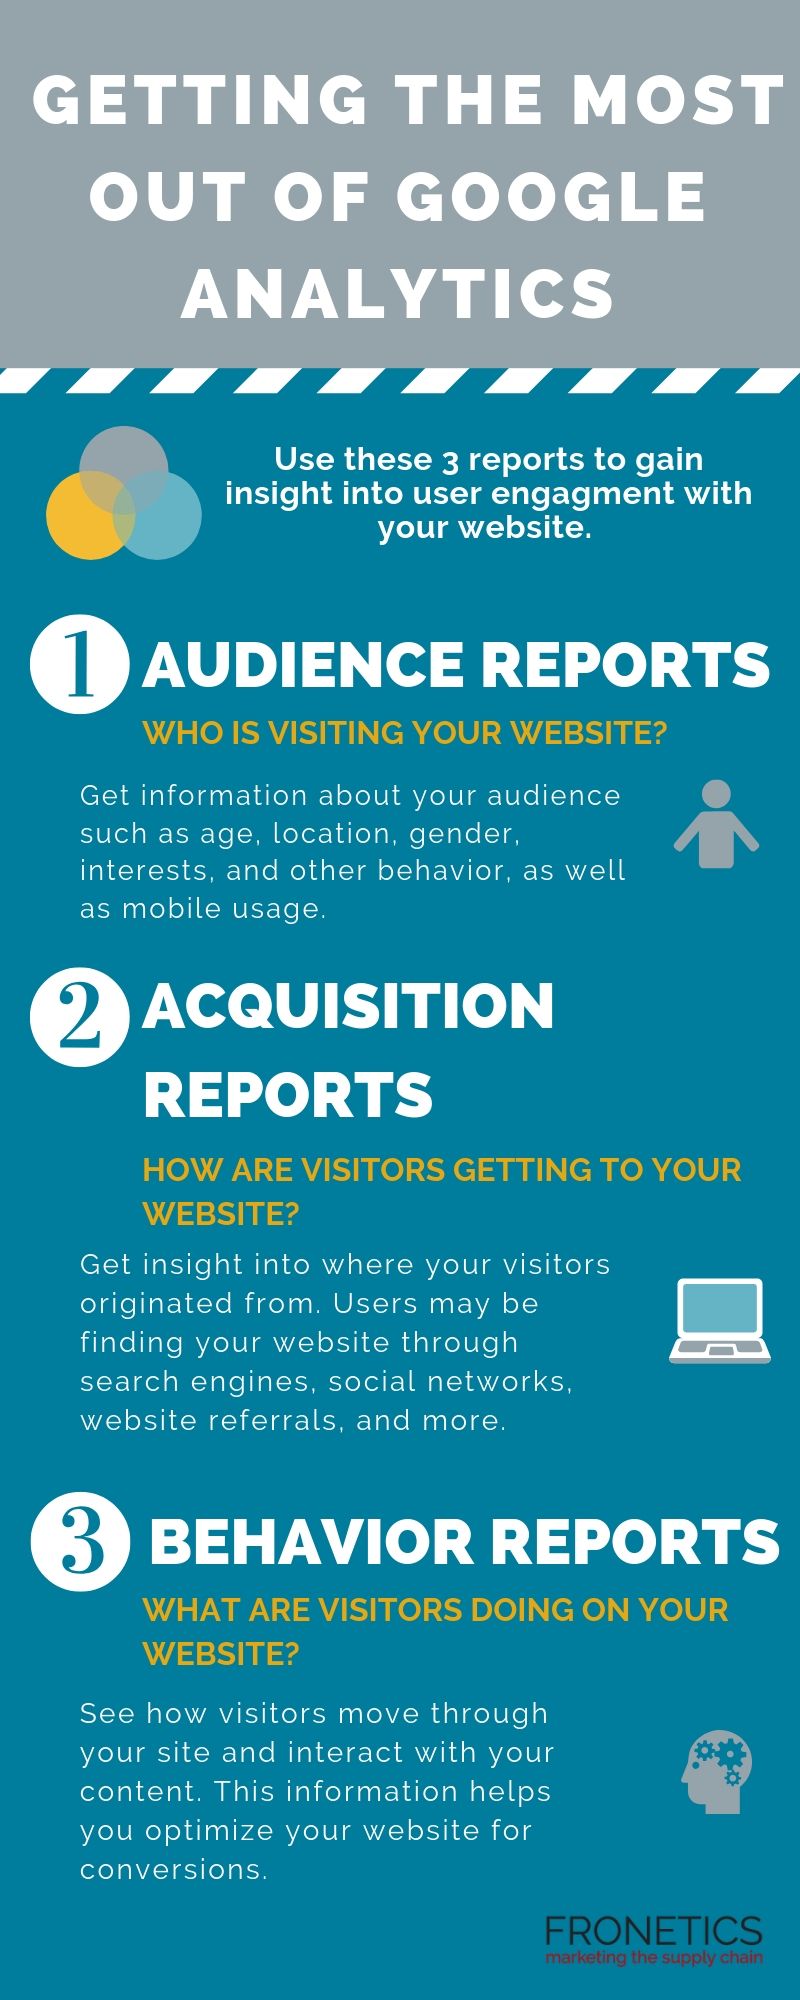
- Audience reports tell you who is visiting your website.
- Acquisition reports convey how are users getting to your website.
- Behavior reports show what visitors are doing on your website.
Your website is your best opportunity to convert digital prospects into leads. But how can you learn who is browsing your website and what they are doing while they’re there? Most importantly, how can you get more of them to convert? Here’s where tools like Google Analytics can help.
Google Analytics is one of if not THE most comprehensive analytics tools available to digital marketers. But it can be very overwhelming if you don’t know how to navigate it. So, we’ve come up with the 3 Google Analytics reports you should be running if you want to understand how to get more visitors to convert on your website.
But, first, let’s start with the basics.
Understanding Google Analytics
At a fundamental level, Google Analytics helps you understand and make decisions based on the traffic that comes to your website. This free tool is a powerhouse that uses a JavaScript code to collect data surrounding how users interact with your website. It then processes that data and generates customizable reports for you within the platform.
[bctt tweet=”This free tool is a powerhouse that uses a JavaScript code to collect data surrounding how users interact with your website. It then processes that data and generates customizable reports for you within the platform.” username=”Fronetics”]
I should say: the data you gain from Google Analytics is all the richer if you begin by setting up Goals on the platform. This way, Google Analytics can go to work for you, measuring how well your website is fulfilling your specific objectives. If you start by properly setting and configuring your goals, Google Analytics can provide you with critical information that’s specific to your strategy. Of course, you can always add to or adjust your goals, as you collect data.
Getting the most out of Google Analytics can empower you to make improvements to your website based on the data it collects for you. The more information you have about your site and its traffic, the more you can make adjustments to meet your objectives. Furthermore, the insights you gain from your metrics can help shape future objectives, to improve user experience on your site.
3 Google Analytics reports that are key to getting the most out of the platform
Using Google Analytics, you can gain insight into some of the most important questions surrounding user engagement with your website. In particular, these 3 reports are helpful in getting the most useful data for understanding lead conversion opportunities:
- Audience reports: Who is visiting your website?
- Acquisition reports: How are users getting to your website?
- Behavior reports: What are website visitors doing on your website?
Here’s what you need to know about each report.
1) Audience reports
As you create and publish content on your website, you need to know who’s reading/watching/viewing/listening to it. With Google Analytics, you can get information about your audience such as age, location, gender, interests, and other behavior.
As users are increasingly engaging with websites on mobile devices, we often encourage clients to monitor the Mobile report as well as other audience demographics. This report shows you what percentage of your audience comes from a mobile device, as compared to a desktop or tablet. You need this information, particularly because mobile device users tend to have different behavior and goals from those on desktops. If your traffic is heavily mobile, your site needs to be optimized for these visitors.
We also encourage clients to make use of Google Analytics’ audience benchmarking reports. These reports allow you to compare your results with aggregated industry data, giving you the context you need to set targets. Benchmarking can also give you insights into industry-wide trends and help you determine how you’re doing as compared to your competitors.
2) Acquisition reports
Knowing how visitors are getting to your website will empower you not only to improve your site, but to make strategic decisions surrounding your other digital channels. Google Analytics offers acquisition reports that provide insight into where your visitors originated from. Users may be finding your website through search engines, social networks, website referrals, and more.
Use the Acquisition Overview to get a quick overview of the top channels that are funneling visitors to your website. You can also see associated acquisition, behavior, and conversion details for each of these channels. If you have your Google Analytics Goals in place, the Acquisitions Overview report will display how well each channel is driving conversions.
Next, take a deeper dive in the Channels section, which gives you rich information about each of your channels. For example, if you click on the “Organic Search” channels, Google Analytics takes you to the Keywords report, which lets you know how you’re faring with specific search queries. Clicking the “Direct” channel will take you to the top landing pages for direct site visitors, and “Social” shows you your top-referring social networks.
3) Behavior reports
Once visitors are on your site, what are they doing there? If you’re getting the most out of Google Analytics, you can see how visitors move through your site and interact with your content – and, in turn, you can be strategic about optimizing your website for conversions.
Start with the Behavior Overview. Here, you’ll find a graph of the amount of traffic your website receives, as well as additional metrics such as Pageviews, Average Time on Page, Bounce Rate, and more.
For more insight, the Behavior Flow report shows you the path users typically take on your website. You can see the first page they view, all the way to the final page they typically visit before exiting your site. Here, you’re getting a visual of how long visitors stay on your website — and learn a bit about why they leave.
The bottom line: Google Analytics reports help you optimize your website
Data empowers you to make informed decisions and tailor your strategies to meet your objectives. Not only that, data can help you determine your objectives in the first place. Google Analytics is perhaps the most robust tool out there for gathering information and insights into essentially every aspect of your website. Make sure you’re making use of it.
What Google Analytics reports have you found most helpful?
Related posts:
- 5 Tips for Achieving the Most Out of Your Supply Chain Analytics
- How Big Companies Use Big Data
- Why Content Marketing Depends on Metrics